Marketing Analytics Without BI Tools
This is an interview with one of our user.
Every Monday morning at 9 AM sharp, he’d arrive at the office with what came next: building the weekly marketing report.
First, he’d export data from Google Analytics. Then Facebook Ads. Then Instagram. LinkedIn. Google Ads. Mailchimp. Our CRM. That’s seven different platforms, seven different CSV downloads, all with slightly different date formats and field names.
Next, copying and pasting numbers into the master Excel template. Checking formulas. Fixing the broken ones (there were always broken ones). Making sure nothing looked suspicious. Calculating percentage changes manually because Excel kept giving me #DIV/0! errors.
The whole process ate up three to four hours every single week. And you know what the worst part was? By the time he finished building the report, it was already outdated.
He spent more time being a spreadsheet janitor than actually being a marketer.
The Spreadsheet Trap
Here’s a shocking stat: research shows that 58% of marketers still build their routine reports in spreadsheets. Not 5%. Not 10%. Nearly 60%.
In 2026. With all the fancy martech tools and analytics platforms and AI assistants we supposedly have access to.
Why? Because despite everything changing in marketing, the way we work with data hasn’t really evolved. We’re still in this weird middle ground where:
- Spreadsheets are too manual and brittle
- BI tools are too complex and expensive
- “Chat with your data” toys can’t handle serious analysis
- And nobody has time to become a data analyst just to answer basic marketing questions
The traditional answer has been “buy a BI tool.” Companies spend tens of thousands on Tableau or Looker or Power BI, assign someone to set it up, and then nobody uses it except maybe that one person who’s slightly more technical.
Meanwhile, the rest of the marketing team is back in Excel, copying and pasting away, because the BI tool is too complicated and the data team is too busy to help.
There’s got to be a better way.
Why Traditional BI Tools Fail Marketers
Let me be clear: BI tools aren’t inherently bad. They’re incredibly powerful for enterprise data teams with specific use cases. But for marketing teams? They’re overkill. And here’s why they usually fail:

- The Setup Nightmare
- Most BI tools require significant upfront investment, not just money, but time and expertise.
You need to:
- Set up data connections and pipelines
- Model your data (what even is a star schema?)
- Design dashboards and reports
- Set permissions and access controls
- Train your team on how to use it
By the time you’re done, three months have passed and your team’s already back to their spreadsheets because they needed answers now, not next quarter
The Technical Barrier
BI tools are built for data analysts, not marketers.
Want to add a new metric to your dashboard? Better hope you understand how to write the right DAX formula in Power BI or know where that field lives in your data warehouse.
Can’t remember if that number should be a count or a sum?
Most marketers didn’t sign up to become engineers. They just want to know if last week’s campaign worked.
The Flexibility Problem
Here’s the thing about dashboards: they’re great at showing you pre-defined metrics. They’re terrible at answering unexpected questions.
Your CMO asks in Monday’s meeting: “How did our email campaign perform for users who came from paid social versus organic search?” If that comparison isn’t already built into your dashboard, you’re stuck. You either need to:
- Build a new dashboard (if you even know how)
- Export the raw data and analyze it in, wait for it, a spreadsheet
- Email the analytics team and wait three days
None of these options are acceptable when you need to answer the question right now.
The Collaboration Black Hole
BI tools treat reporting as a spectator sport.
Someone builds a dashboard, shares a link, and everyone else just looks at it. Maybe they click a filter or two if they are free.
But marketing isn’t about passive consumption of data. It’s about discussion, iteration, and collaborative decision-making. You need to add context, share hypotheses, debate what the numbers mean, and decide what to do next.
Dashboards don’t support any of that. They’re one-way streets.
The Spreadsheet Stockholm Syndrome
So if BI tools don’t work for most marketing teams, why not just stick with spreadsheets?
Because spreadsheets are slowly killing your marketing effectiveness. Let me count the ways:
1. Manual data hell
Every time you need updated numbers, you’re manually exporting and importing data. This doesn’t scale. At all.
Most marketer I know was spending 10+ hours a week just updating spreadsheets. That’s 25% of the job. You weren’t hired to be a data entry clerk.
2. Error-prone by design
One wrong formula, one misaligned cell, one accidental deletion, and your entire report is garbage. And you might not even notice until someone points out that your conversion rate is supposedly 347%.
Studies show that nearly 90% of large spreadsheets contain errors. Most go undetected.
3. Version control disaster
“Is this the latest version? Or is it Marketing_Report_FINAL_v3_ACTUALLY_FINAL_THIS_TIME.xlsx?”
When five people are working in different copies of the same spreadsheet, you inevitably end up with conflicting data and nobody knows what’s real.
4. Zero governance
Anyone can change anything. Numbers get updated with no audit trail. Formulas get “fixed” in ways that make things worse. Important context disappears when someone accidentally deletes a note.
Good luck explaining to your CEO why this month’s numbers look completely different from the preliminary report you shared last week.
5. Doesn’t scale beyond the basics
Want to analyze customer cohorts? Run attribution modeling? Understand multi-touch campaign impact? Yeah, good luck doing that in Excel. You’ll be writing VLOOKUP formulas for the next three days.
What Marketing Teams Actually Need
Let’s step back and think about what marketers actually need from their analytics tools.
Speed matters more than power
I’d rather have a decent answer in 30 seconds than a perfect answer in 30 hours. Marketing moves fast. By the time you’ve finished your sophisticated analysis, the campaign’s already over.
Natural language, not SQL
Marketers shouldn’t need to learn query languages to answer questions like “Which campaign drove the most conversions last month?” That’s ridiculous.
The tool should adapt to how marketers think, not force marketers to adapt to how databases work.
Collaboration, not silos
Marketing is a team sport. Your analytics should support discussion, iteration, and collective decision-making, not just data consumption.
When someone finds an insight, the team should be able to jump in, explore it together, ask follow-up questions, and decide on action items. All in the same place.
Context + data together
Numbers without context are just numbers. You need to be able to put your metrics right next to:
- Explanations of what they mean
- Notes about what campaigns were running
- Hypotheses about what’s driving changes
- Decisions about what to do next
Traditional BI separates the data from the story. That’s backwards.
Real-time or forget it
Static reports are dead the moment you build them. Marketing metrics should update automatically so you’re always looking at current data, not last week’s snapshot.
Accessible to everyone, powerful for those who need it
The junior marketer should be able to answer simple questions without help. The data-savvy growth marketer should be able to run sophisticated analyses when needed.
One tool, both audiences.
Common Marketing Analytics Scenarios
Let me walk through some real scenarios to show why this matters.
Scenario 1: Campaign Performance Review
The Question: “How did our Q1 email campaigns perform compared to Q4?”
With spreadsheets: Export email data for both quarters. Copy into your template. Calculate open rates, click rates, conversion rates. Build comparison charts. Update the presentation deck. Total time: 2+ hours.
With BI tools: Hope someone already built a dashboard with this exact view. If not, submit a request to analytics and wait. Or try to build it yourself and probably mess something up. Time: Days to never.
What you actually need: Type the question, get a chart comparing the quarters instantly. Add it to your campaign review doc. Done in 90 seconds.
Scenario 2: Attribution Deep-Dive
The Question: “Which traffic sources are actually driving our highest-value customers?”
With spreadsheets: Export data from Google Analytics and your CRM. Try to match them up using some combination of email addresses and timestamps that’ll never quite work right. Give up and just look at first-touch attribution because it’s easier. Miss all the nuance.
With BI tools: If you’re lucky, someone set up attribution modeling six months ago. If you’re unlucky, it’s in your backlog. Either way, you can’t easily adjust the attribution window or model to test different scenarios.
What you actually need: Ask questions about different attribution models, instantly see how the numbers change, save the analysis that makes sense for your business.
Scenario 3: Ad Spend Optimization
The Question: “Where should we allocate budget next month based on performance?”
With spreadsheets: Export data from every ad platform. Normalize the metrics (Facebook calls it “ROAS” while Google calls it “Return on ad spend” and they calculate slightly differently). Build a comparison. Realize the data doesn’t include the promotional codes each platform uses so you can’t actually track sales back to the source. Cry.
With BI tools: If your data engineer managed to set up unified tracking (rare), you might have a pre-built dashboard for this. But it probably doesn’t let you test different budget allocation scenarios or factor in platform-specific considerations like minimum spends.
What you actually need: Pull data from all platforms automatically, see unified metrics, run what-if scenarios on budget allocation, collaborate with your team on the plan.
The Modern Alternative: AI-Powered Collaborative Analytics
Here’s what the future of marketing analytics actually looks like.
Imagine a workspace where:
- You can ask questions in plain English and get instant answers with charts
- All your marketing data sources automatically stay synced
- Your team collaborates in real-time on the same analysis
- Context and strategy live right next to the numbers
- Everything updates automatically, always showing current data
- Non-technical marketers can explore data, while technical users can write custom queries when needed
This isn’t fantasy. This is how modern data teams already work. Marketing just hasn’t caught up yet.
The key is combining:
- Natural language AI for accessibility
- Collaborative workspaces for teamwork
- Live data connections for freshness
- Flexible analysis tools for power users
- Rich context for storytelling
You get the speed of spreadsheets without the manual hell. You get the power of BI tools without the complexity. And you get collaboration that neither of them offers.
How Livedocs Transforms Marketing Analytics
Okay, let’s talk about how this actually works in practice, specifically with Livedocs, because it’s built for exactly this use case.
The Marketing Analytics Problem Livedocs Solves
Traditional tools force you to choose: simple but limited (spreadsheets) or powerful but complicated (BI tools). Livedocs gives you both.
For the everyday marketer:
You can ask questions in plain English: “Show me conversion rates by traffic source for the past 30 days” and immediately get back a chart. No SQL, no query builders, no technical knowledge required.
Connect your marketing data sources, Google Analytics, Facebook Ads, email platforms, your CRM, and they stay synced automatically. No more manual exports and imports.
For the data-savvy growth marketer:
When you need to go deeper, you have full SQL and Python available. Run cohort analyses, build attribution models, create custom metrics, all in the same workspace.
The AI can help generate queries if you get stuck, but you have complete control when you need it.
Why Livedocs Works for Marketing Teams
Here’s the game-changer: your entire team can work together in the same document.
Your paid ads specialist adds Facebook campaign data and analysis. Your content marketer drops in organic traffic trends. Your email person adds campaign performance. Your CMO adds strategic context and next steps.
Everyone’s working with the same live data, adding their perspectives, having discussions right alongside the numbers. It’s how marketing teams actually work, not isolated dashboard viewers, but collaborative strategists.
Context and data aren’t separate anymore
Instead of numbers in Tableau and strategy in Notion and discussion in Slack, everything lives together. You can build a document that shows:
- Current campaign performance (updating automatically)
- What you learned from last quarter
- Your hypothesis for what’s driving changes
- Team discussion about next steps
- The decision you made and why
The data isn’t divorced from the story. They’re intertwined, the way marketing actually works.
Campaign analysis that’s actually fast
Monday morning meeting needs campaign performance numbers? Pull up Livedocs, ask “How did last week’s campaigns perform?”, get instant charts showing opens, clicks, conversions across all channels. Add them to your meeting doc. Total time: under 2 minutes.
Want to compare different attribution windows? Change the parameters, see how numbers shift, save the view that makes sense. No waiting on the analytics team.
Need to share with stakeholders? Give them access to the living document. They see the same current data you do, no emailing static PDFs that’ll be out of date tomorrow.
Templates for common analyses
Your data-savvy marketer can build templates for recurring analyses, weekly campaign reviews, monthly channel performance, quarterly attribution reports.
Then the rest of the team can use these templates, customize them for specific needs, and instantly get reliable results without starting from scratch each time.
It’s the self-service model that actually works: experts create the foundation, everyone else builds on it.
Multi-source analysis without the headache
Want to see how paid social visitors behave compared to organic search visitors? Livedocs can pull data from Google Analytics for behavior metrics and Facebook Ads for campaign costs, then combine them for unified analysis.
No complex data pipelines to maintain. No waiting for engineering. Just connect the sources and start analyzing.
Real Marketing Workflows with Livedocs
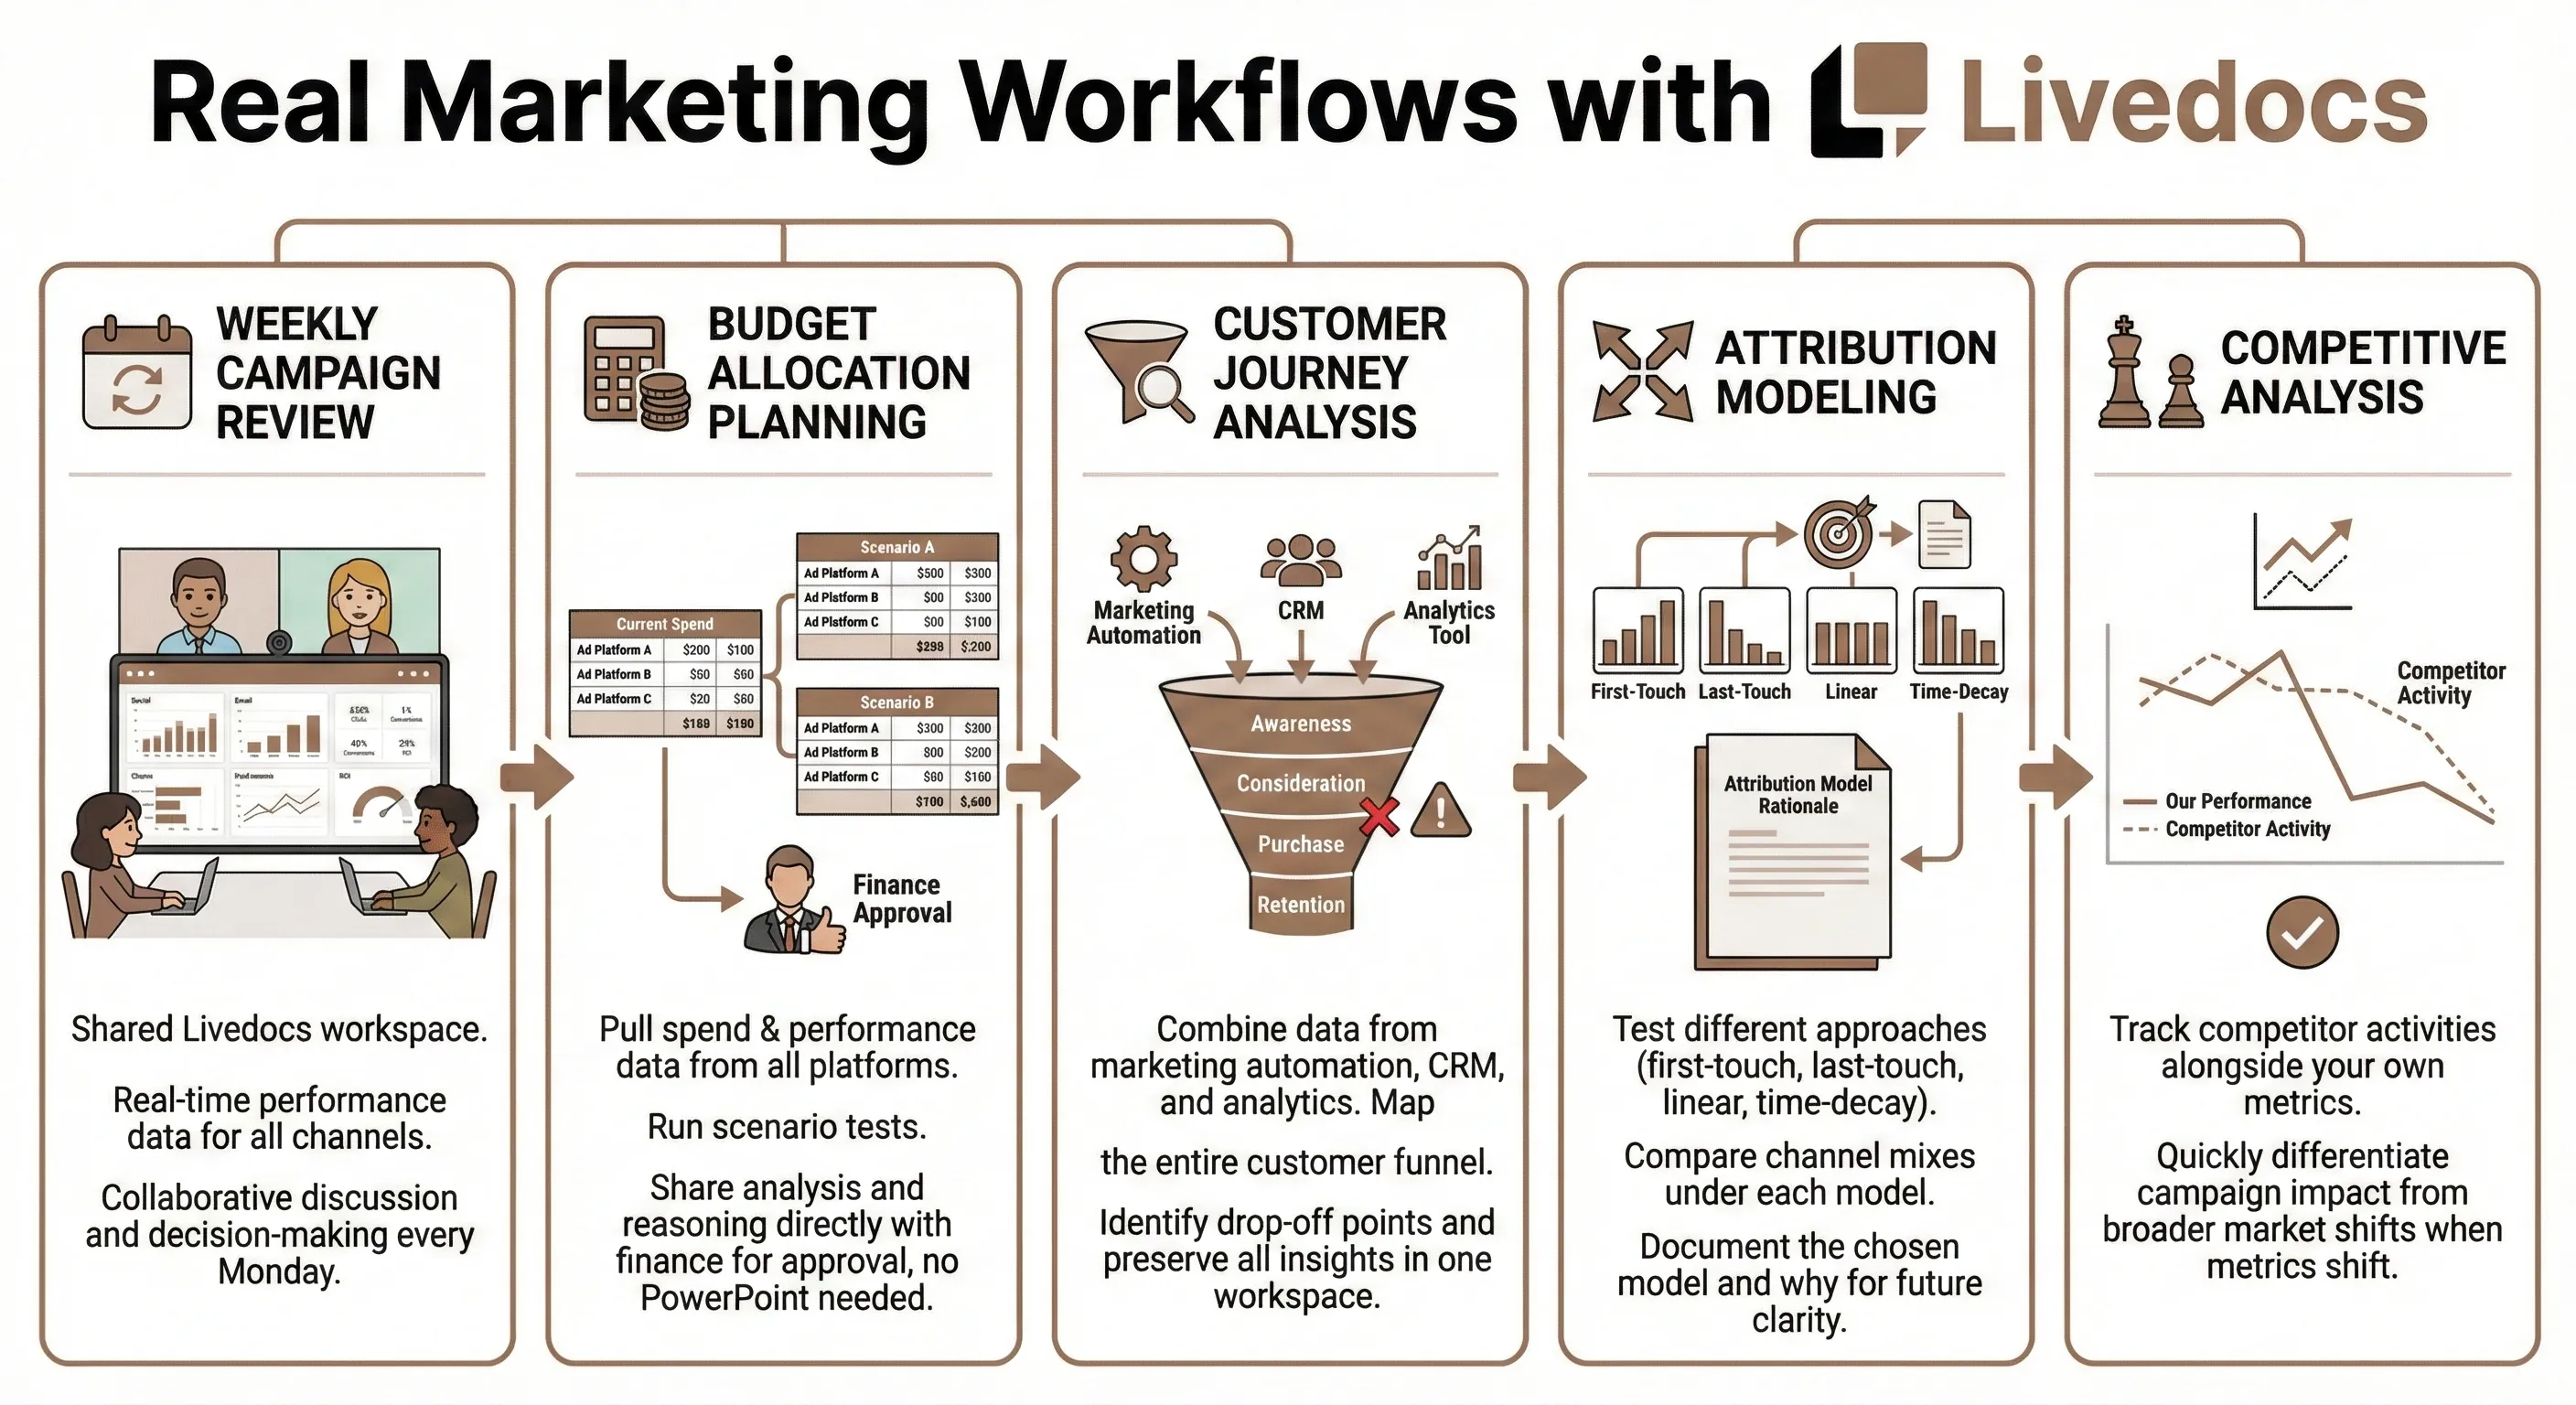
Weekly campaign review:
Your team has a shared Livedocs workspace for campaign tracking. Every Monday, everyone opens the same doc that shows updated performance across all channels. You discuss what’s working, what’s not, and make decisions together, all in one place.
Budget allocation planning:
Pull spend and performance data from all ad platforms. Run scenarios testing different budget allocations. Share with finance for approval. They can see your analysis, understand your reasoning, and approve, without you needing to recreate everything in PowerPoint.
Customer journey analysis:
Combine data from your marketing automation platform, CRM, and analytics tool. Map how customers move through your funnel. Identify drop-off points. All the sources connected, all the analysis in one workspace, all the insights preserved with context.
Attribution modeling:
Test different attribution approaches, first-touch, last-touch, linear, time-decay. See how your channel mix looks under each model. Document which model you’re using and why, so when someone asks six months from now, the answer is right there.
Competitive analysis:
Track competitor activities alongside your own performance. When your metrics shift, you can quickly check if it’s your campaigns or broader market dynamics.
Making the Shift: From Spreadsheets to Smart Analytics
Changing how your team works with data is hard. Not because the tools are complicated, Livedocs is actually simpler than managing a forest of spreadsheets, but because change itself is hard.

Here’s how to make it stick:
Start With One Use Case
Don’t try to move everything at once. Pick one painful process, maybe your weekly campaign review or monthly performance reporting, and solve that first.
Get it working smoothly. Let your team experience the difference between spending three hours updating spreadsheets versus getting instant answers to questions.
Success breeds adoption. Once people see the value, they’ll want to use it for everything else.
Train Your Team on Asking Good Questions
The barrier to entry is low, anyone can ask questions in plain English. But getting great insights requires asking good questions. Run a workshop on:
- How to frame questions precisely
- What follow-up questions to ask when exploring data
- How to validate that results make sense
- When to dig deeper versus when you have enough
The goal isn’t to make everyone a data analyst. It’s to make everyone data-curious and comfortable exploring.
Build a Culture of Data Collaboration
Encourage your team to share interesting findings. When someone discovers something valuable, make it visible.
Create shared workspaces for different teams or initiatives. Make it normal to jump into someone else’s analysis, ask questions, add observations.
The more collaborative your analytics culture, the smarter your collective decisions.
Phase Out Spreadsheets Gradually
As you build confidence in your new system, gradually migrate analyses from spreadsheets. Keep spreadsheets for what they’re actually good at (ad-hoc calculations, one-off exports), but move recurring reporting to your collaborative analytics workspace.
This isn’t about eliminating Excel completely. It’s about using the right tool for each job.
Common Concerns
”But we’ve always used spreadsheets”
So did everyone else. Then they realized there’s a better way.
The question isn’t “what have we always done?” It’s “what’s the most effective way to work given today’s options?"
"Our team isn’t technical enough”
That’s exactly the point. Tools like Livedocs are designed for non-technical users. If you can ask a question in English, you can use them.
And for team members who are technical, they have deeper capabilities available. But you don’t need those to get started.
”We can’t afford another tool”
Calculate how much time your team currently spends on manual data work. Multiply that by your average salary. That’s what spreadsheets are actually costing you.
Most teams find that modern analytics platforms pay for themselves in saved time within a month.
”What if we need something custom that the tool can’t do?”
Unlike traditional BI platforms, collaborative analytics tools like Livedocs let you write custom code when needed. You’re not locked into pre-built visualizations or metrics.
Start with the easy stuff using AI assistance. Graduate to custom analysis when you need it. Both are possible in the same tool.
”Our data is too messy”
Everyone’s data is messy. That’s not a reason to avoid better tools, it’s a reason to use them.
Modern analytics platforms help you clean, transform, and normalize data as part of the analysis process. They don’t require perfect data to get started.
The Analytics Stack of the Future
Let me paint a picture of what marketing analytics looks like in the next few years.
Spreadsheets become specialized tools
They’ll still exist for quick calculations, data entry, and specific use cases where they shine. But they won’t be the default for all data work.
BI tools become internal engineering products
Large enterprises will still use Tableau and Power BI for specific deep-dive analysis and compliance reporting. But they won’t be what most marketers interact with daily.
Collaborative analytics becomes the default
Most marketing teams will work in collaborative data workspaces where:
- Questions get answered instantly with AI
- Teams work together on analysis in real-time
- Context and strategy live alongside metrics
- Data stays current automatically
- Everyone can contribute at their skill level
The line between marketer and analyst blurs
When the tools are accessible enough, everyone becomes somewhat analytical. You don’t have “analytics people” and “everyone else”, you have marketers who comfortably work with data.
Speed becomes the competitive advantage
The teams that can analyze faster, iterate faster, and make decisions faster will win. The tools enable the speed.
We’re already seeing this shift. Forward-thinking marketing teams have already made the jump. The question is when, not if, everyone else follows.
Final Thoughts
You didn’t become a marketer to spend hours copying and pasting data into Excel. You became a marketer to understand customers, craft compelling campaigns, and drive business growth.
The data should serve that goal. It shouldn’t become the goal itself.
Every hour you spend wrestling with spreadsheets or waiting for BI reports is an hour you’re not spending on strategy, creativity, or growth. That’s the real cost, not just the inefficiency, but the opportunity cost of what you could be doing instead.
Modern marketing analytics tools exist that let you:
- Get answers in seconds, not hours
- Collaborate with your team naturally
- Keep context and data together
- Stay focused on insights, not infrastructure
Tools like Livedocs prove that you don’t need to choose between simplicity and power, between accessibility and flexibility. You can have both.
Use Livedocs for faster and effective data analysis.
- 8x speed response
- Ask agent to find datasets for you
- Set system rules for agent
- Collaborate
- And more
Get started with Livedocs and build your first live notebook in minutes.
- 💬 If you have questions or feedback, please email directly at a[at]livedocs[dot]com
- 📣 Take Livedocs for a spin over at livedocs.com/start. Livedocs has a great free plan, with $10 per month of LLM usage on every plan
- 🤝 Say hello to the team on X and LinkedIn
Stay tuned for the next tutorial!
Ready to analyze your data?
Upload your CSV, spreadsheet, or connect to a database. Get charts, metrics, and clear explanations in minutes.
No signup required — start analyzing instantly